Undoubtedly, the coronavirus pandemic has caused major, and at times
lasting, effects on our lives. From how we work, to where we go to
school, to how we shop, to how we socialize, our habits and routines
have adapted to a new normal of increased remote access opportunities.
The rise of telework, teleschool, online shopping, and video-chatting
have decreased our need to leave our homes. In the immediate and
uncertain days of the pandemic, these changes allowed for us to continue
with our lives without in-person connection, slowing the transmission of
the disease in the hopes of saving lives.
With the worst days of the pandemic now (hopefully) in our
rearview mirror, this “new normal” has had some lasting effects on our
routines. In looking at American transportation patterns, we can see the
effects of the pandemic on how often, how far, and with which
transportation methods we travel, from the early days of the pandemic to
now, nearly two years later.
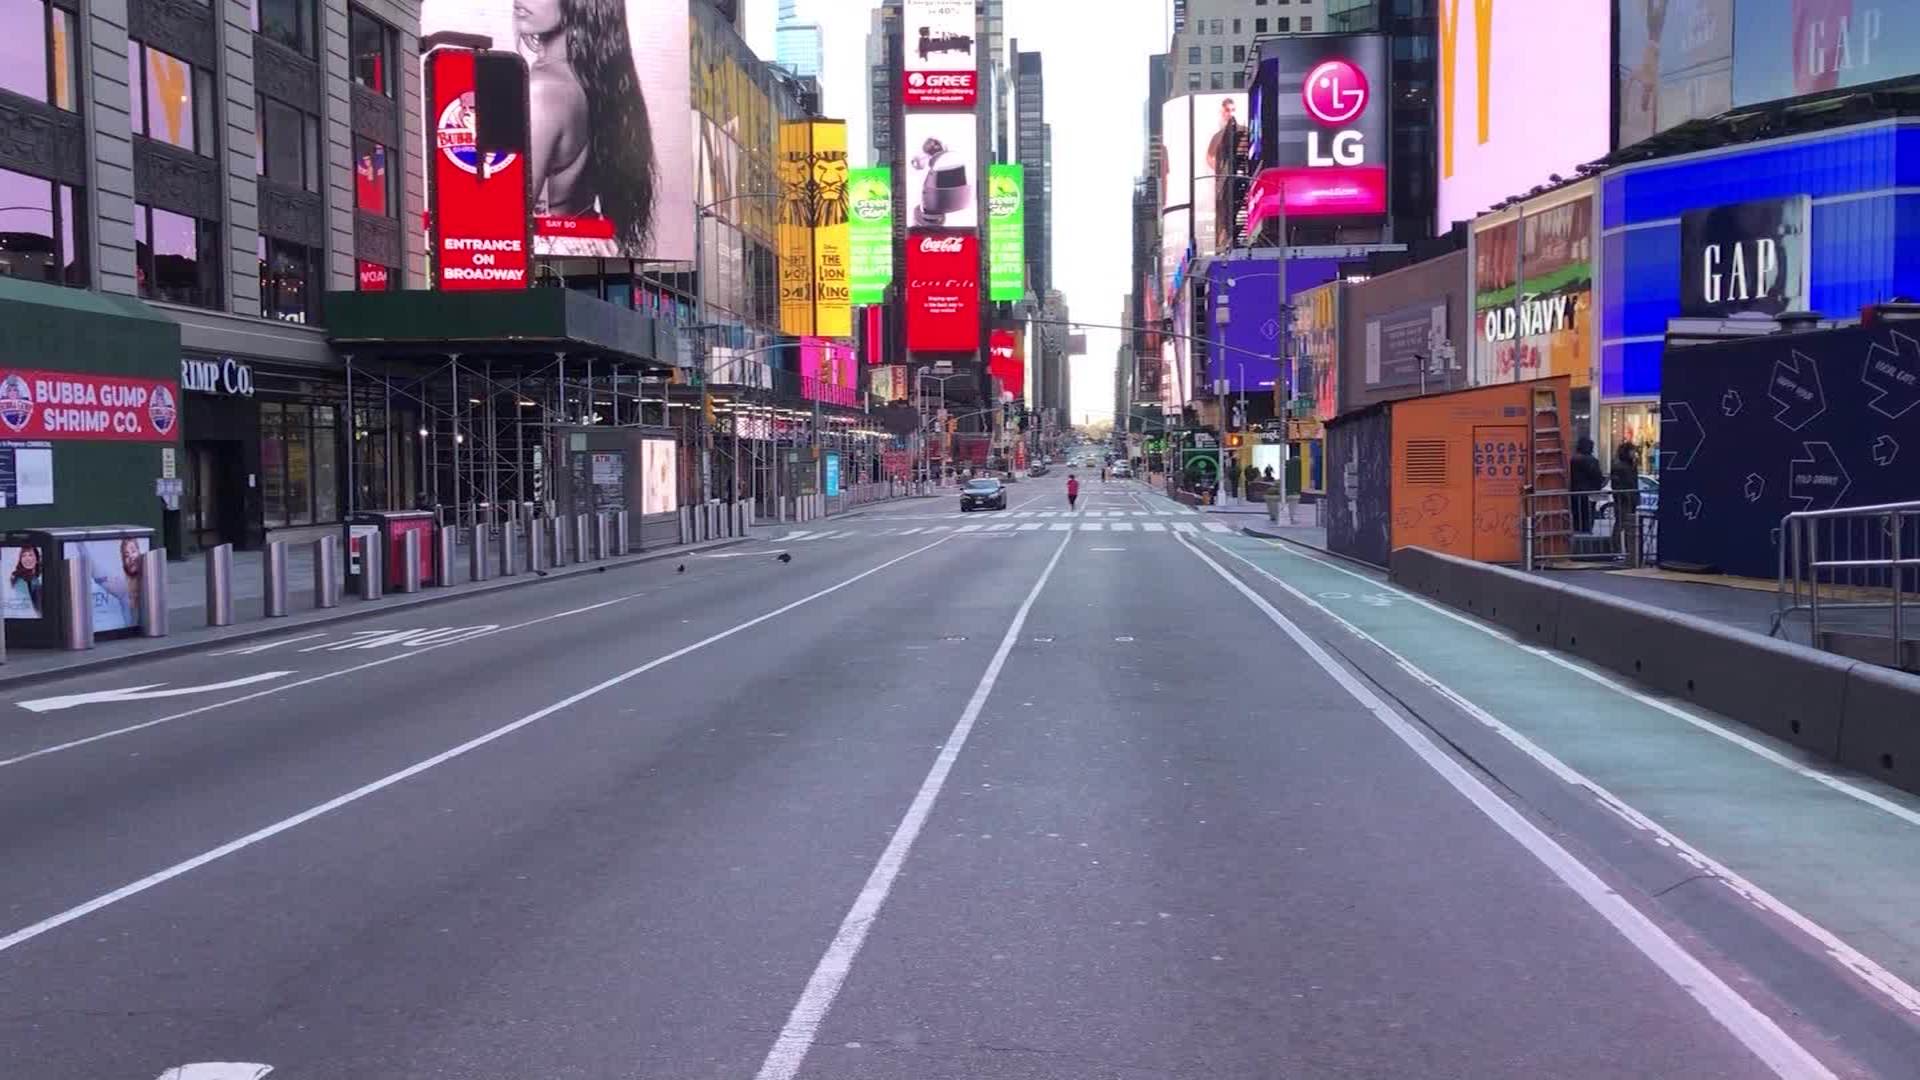
An empty scene in Times Square in New York City, April 2, 2020. Source: CNN
The pandemic’s effects on travel varied by location.
As shown in the maps above, regional differences in the United States
impact travel patterns. The Southeast, both before and during the early
days of the pandemic, has a higher mobility rate, or more people, on
average, leave their homes on a given day.
Across the country, however, travel decreased significantly in April as
the pandemic spread through the country and lockdowns took effect. April
had the lowest rate of people leaving their homes. Nationally, April 2,
2020 had a mobility rate of just over 63%. For context, the rate on
April 2, 2019, just a year prior, was 89%. Such a change in the amount
of travel in the United States likely has a variety of causes: school
cancellations, telework opportunities, restaurant and bar closures, and
more reduced the need for Americans to risk their health and leave home.
Percent Change in Mobility Rates By State
As a Percent of 2019 Mobility Data
Data from the US Department of Transportation's Daily Trips By Distance dataset.
Interestingly, however, after the initial few months of the pandemic, the second half of 2020 and beginning of 2021 saw a resurgence of people traveling outside of the home. In fact, the spring and summer months of 2021 had a higher rate of travel year-over-year, showing a return, at least in part, to travel. Each state had a different path of mobility patterns through the pandemic, which different state laws permitting varying levels of travel. To explore these trends, hover over various states above.
The pandemic not only affected if people would leave their homes, but also how far they traveled; in fact, local travel of less than 1 mile, was only somewhat decreased during the pandemic. Further travel was more severely impacted by the pandemic. Flight and travel cancellations undoubtedly had a role in the lower number of long trips taken. In 2020, over 4,000 flights, constituting over 1% of total flights, were cancelled entirely, with another 6% rescheduled to a later time. (Source: The Federal Aviation Administration)
National Number of Trips Taken By Distance From Home
Daily Data (in miles)
Data from the US Department of Transportation's Daily Trips By Distance dataset.
While travel, both near and far, has rebounded since the early days of the pandemic in 2020, travel is still below its 2019 numbers. Though we are only a couple years removed, it appears that there has been a longer-term effect of the pandemic on our travel patterns, even as lockdowns, flight cancellations, and public health concerns have subsided.
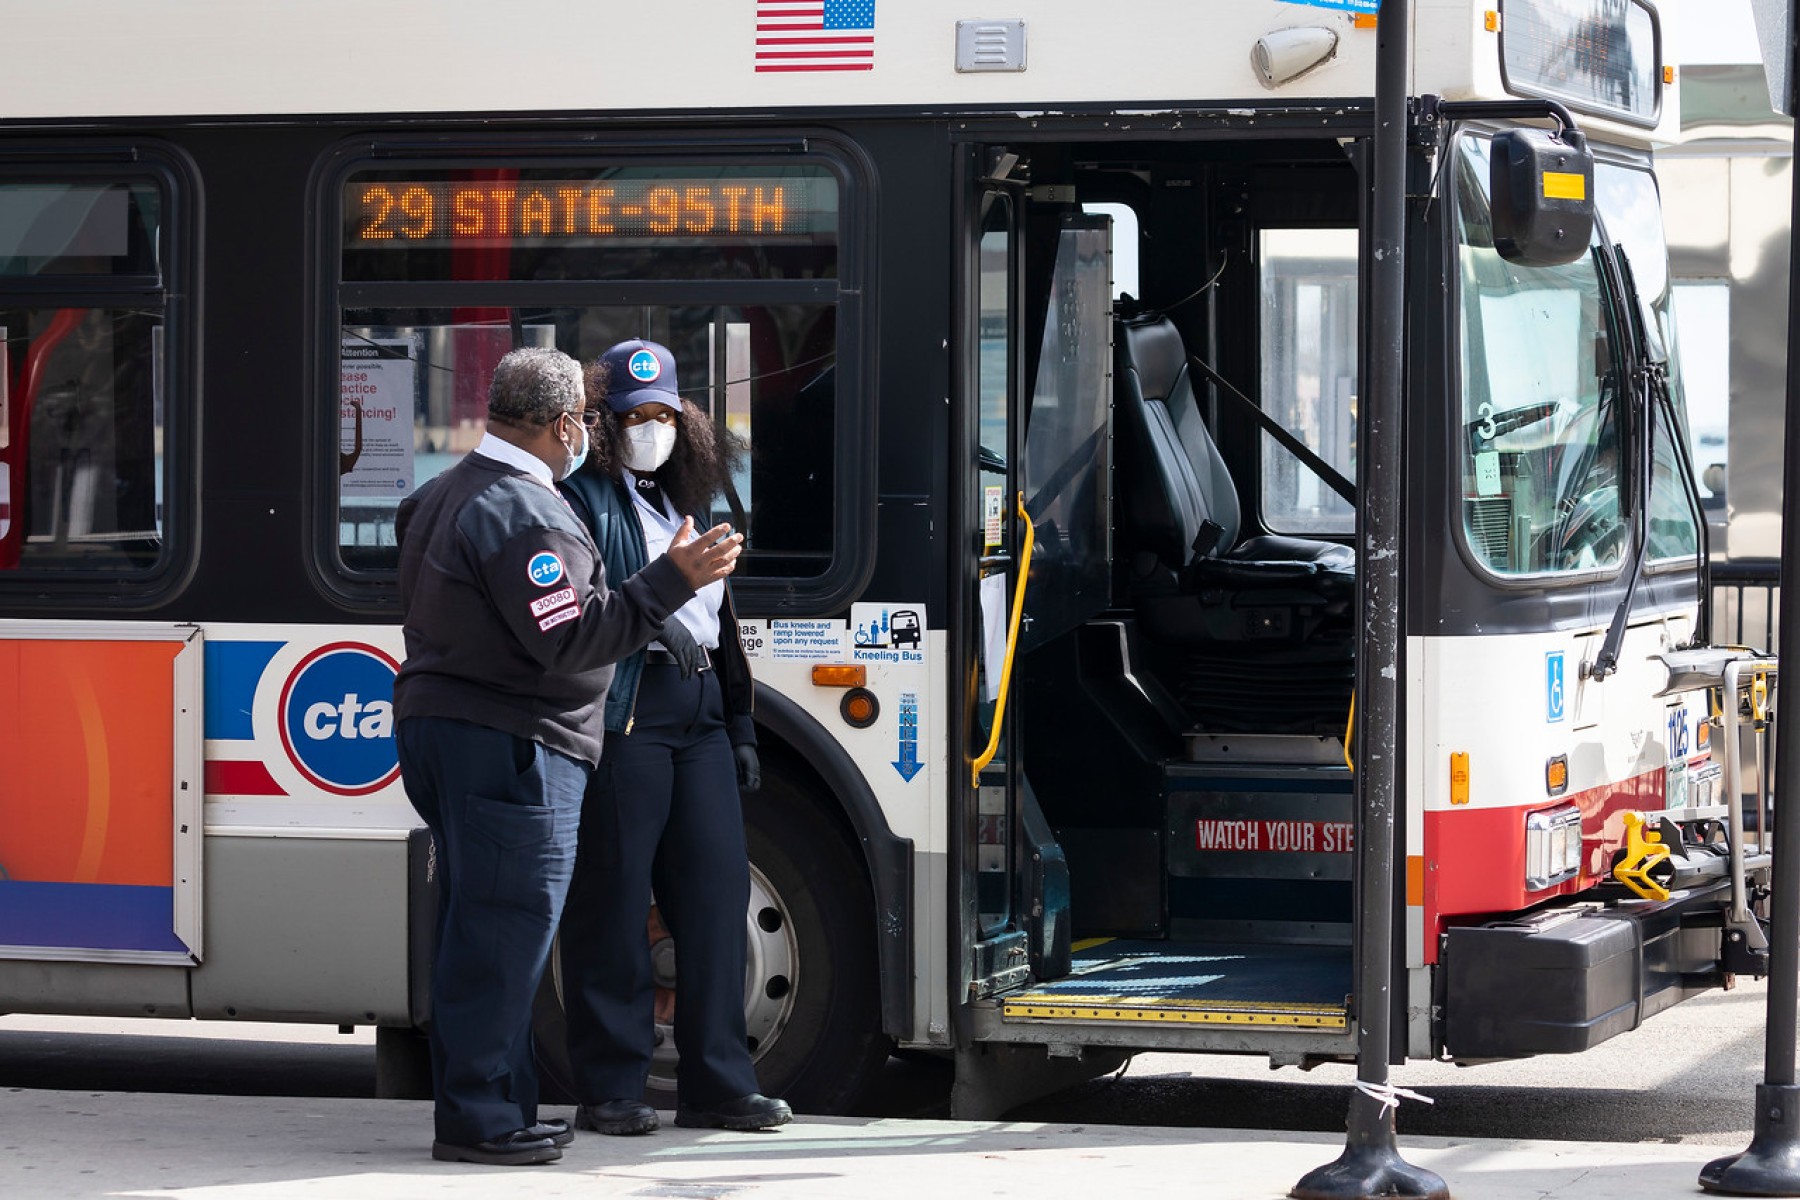
Bus drivers in masks in Chicago, IL, April 2020. Source: Active Transportation Alliance
While car traffic has resumed, public transportation and aviation remain below their 2019 ridership numbers.
Every day, millions of commuters in the U.S. continue to rely on public
forms of transportation, whether that is buses, rail, or aviation. Along
with the decreased need to travel due to telework, teleschool, and other
remote opportunities on the rise, the COVID-19 pandemic also forced
riders to contend with social distancing and other safety measures. To
adapt to the spread of the airborne virus, transportation agencies in
major cities had to quickly change how they offered services. On planes,
buses, and rail lines, social distancing measures, masking requirements,
and decreased vehicles in service greatly impacted transportation as we
know it.
In fact to this day, bus, rail, and aviation ridership numbers remain
below their 2019 rates, with buses racing the most significant decrease
in ridership. The only form of transportation near its initial rate
(denoted by miles traveled nationally) is automobile traffic. As car
usage has rebounded, other, public forms of transportation have failed
to recover quickly. It is unknown if such travel will return. As more
remote socialization and working options arise, perhaps public
transportation's levels will remain at their decreased clip, though only
time can tell.
Percent Change in Mobility Rates By Transportation Type
As a Percent of 2019 Transportation Ridership Data
Data from the US Department of Transportation's "Week in Transportation" Passenger Modes Percent Change from Baseline data.
While some pandemic-related changes to our transportation and travel have subsided, longer-term effects, such as decreased public transportation ridership, remain. In our new world of telework and video-conferencing with loved ones, where we go and how we get there remain an evolving process.